Quality control of NGS data in Galaxy
Go to back to Galaxy beginner's tutorial#Galaxy 'DNA' workshop exercises
In this exercise, we will explore some basic quality control of Illumina datasets using Galaxy.
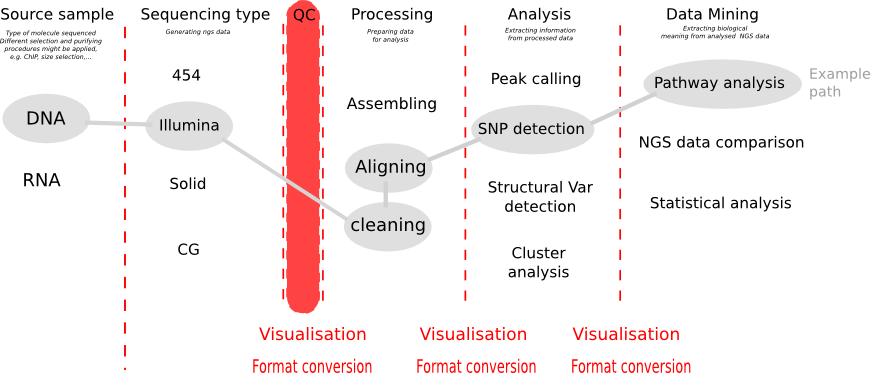
Before analysing your NGS data, first draw a path in the diagram above. Especially the end-point, what you want to achieve with your data, determines all of the step beforehand. Whether you want to detect SNP variations, or structural variation, or want to assemble RNA seq data or align it to the genome, this influences which processing you want to choose.
Contents
Intro
After generation of NGS reads the first step is to look at the quality of the reads. Illumina reads are produced by various series of Illumina machines (Hiseq 2000, MiSeq,...), but as a rule Illumina reads are relatively short (from 30 bp to 150 bp) and can be single-ended (rather rare these days) as paired-ended.
Go to http://galaxy.bits.vib.be, log in with your credentials. Go fetch the four Illumina sample datasets out of the data libraries, in Illumina Sample Data folder under Small Illumina sample (in the last folder).
Visualize quality statistics of fastq datasets
You have now four small Illumina NGS datasets in your history.
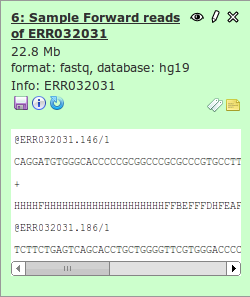
| What file format are the just imported datasets? How big are the datasets? |
|---|
| Click on the title in the history. All datasets are of fastq type. They range from 22.8MB to 83.6MB. |
|
To get a better feeling of the data, you have visualize statistics of this data. Use the FastQC tool for this.
- Type FastQC in the tool search box
- Click on the tool's name in the toolbox
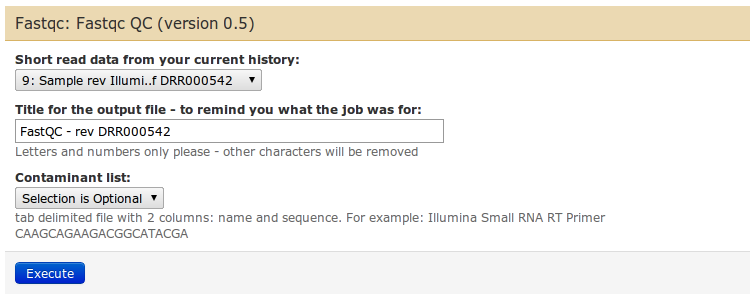
In the middle panel you can configure the parameters of FastQC. There are not many: select the input fastq dataset from the dropdown list, give a name if you want, and leave the contaminants list as default.
The Run the FastQC tool on every dataset. If you need to rerun a tool, do not forget to use the rerun this job button (![]() ) the dataset. Make all jobs at once: you do not have to wait for a job to finish to start building another one.
) the dataset. Make all jobs at once: you do not have to wait for a job to finish to start building another one.
| When the job is done, give the datasets a new and better name name. |
|---|
| Click on the pencil icon |

|
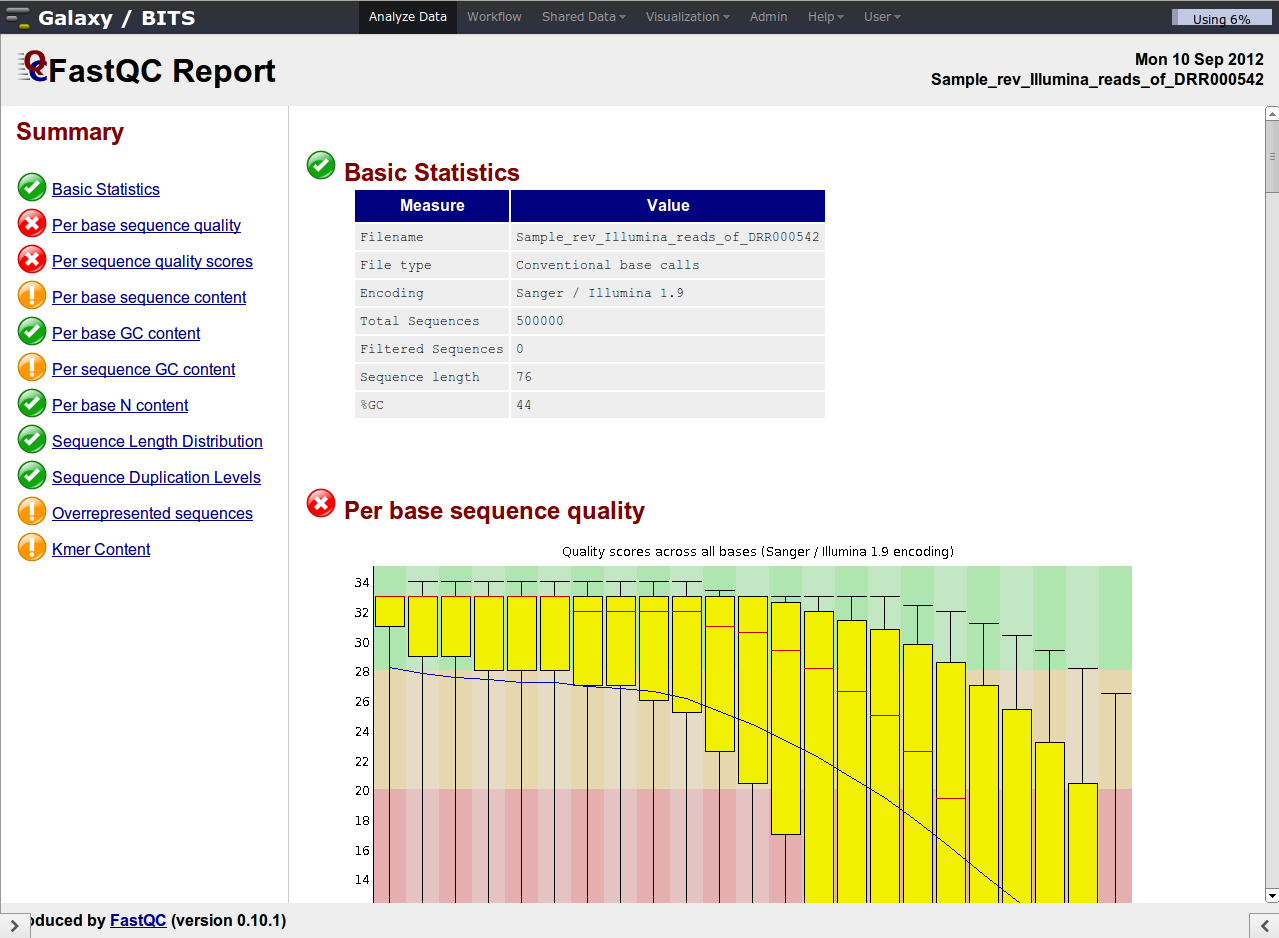
To visualize the result, click on the eye ![]() icon. You will notice that the output is bigger than your screen. Click in the bottom right and left corner on respectively the
icon. You will notice that the output is bigger than your screen. Click in the bottom right and left corner on respectively the ![]() and
and ![]() icons to enlarge the middle pane.
icons to enlarge the middle pane.
Despite the confusing naming of the plots, they are very informative.
Illumina data shows a deterioration of quality toward the 3' ends
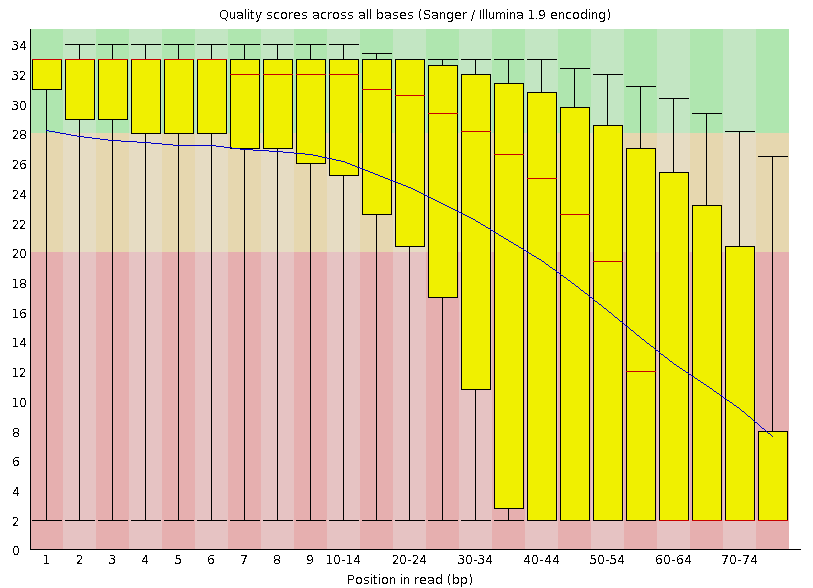
Investigate the 'Per base sequence quality' plot. This plot summarizes over all reads the average quality per position: it shows the box-plot per position in the read and the average smoothed line in blue. The rule-of-thumb is that median quality above score Phred quality score 20 is okay. The positions lower than this Phred score need to be trimmed off. The general rule for trimming is that we trim every read to the same extend (to simulate a shorter number of sequencing cycles), even whether or not a particular read on a trimmed position has Phred quality score higher than 20.
| Which one of the datasets is of lower quality? |
|---|
| The reads derived from sample DRR000542. |
Go over the plots and look for aberrant patterns: e.g. the plot 'Per sequence GC content' showing the GC-distribution over the reads can sometimes not be a nice gaussian-like curve, but can show two peaks, pointing to a source of contamination.
![]() You can click on the eye icon with the scroll-wheel of your mouse: this will open the dataset in a new tab of your browser.
You can click on the eye icon with the scroll-wheel of your mouse: this will open the dataset in a new tab of your browser.
If your dataset does not appear in a tool's input, check the type of data
You can also use the tool 'Quarc' or 'Compute quality statistics' to have some numbers of quality metrics of your fastq data.
| Run Quarc on the fastq datasets (note:this tool is not available on the main Galaxy) |
|---|
| Search for the tool using the tool search box. |
| In the settings: you cannot select the input datasets, because they are not the right format |
| Use the tool Groomer to put the dataset in the right format, or change the attributes of the dataset to type 'fastqsanger' |
| After the datasets are in the right type, use them on Quarc. |
I hope you have noticed the issue with the data types of Fastq. For more information of quality score issues with Fastq datasets, read this Wikipedia entry on the Fastq format. As a rule, convert always all your fastq data to fastqsanger format. This requires knowledge of which platform generated the data. Once done, you are comfortable that your dataset is suited to be analysed further in Galaxy.
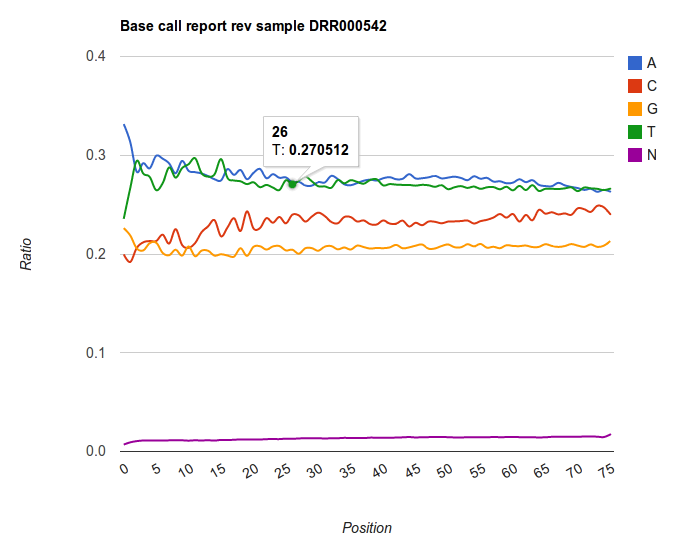
The output of Quarc are two text files, in which the field are separated with tabs (so called 'tabular'). One file summarizes the base distribution over the positions in the read ('Basecalls report'). The other file summarizes the quality score for every position ('Qualities report'). This tabular type of data is typical in Galaxy: many tools exist to manipulate these types of files through cut and paste.
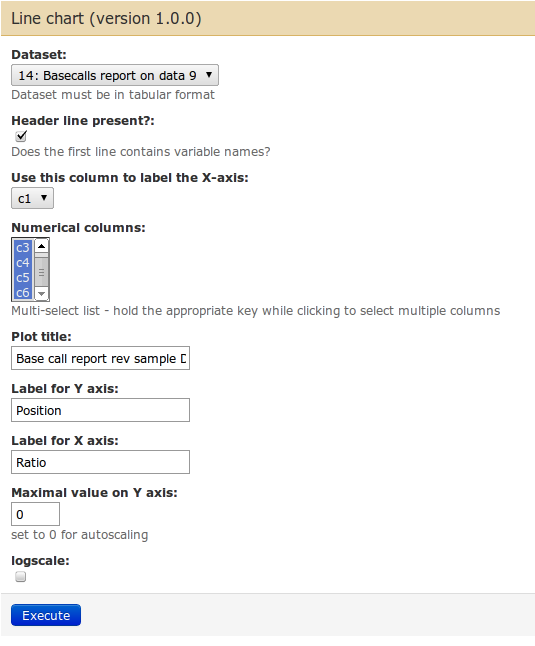
Find the tool Line chart using Google Charts to display this data (note: tool not on Main Galaxy). You can use following screenshot to guide you.
The result is an graph showing the ratios of base over the differing positions. Note the trends that are present in Illumina datasets: very rarely the base distribution are similar for every position. We rather see hard to explain patterns appearing, and an enrichment of certain base to the end of the read. Keep this always in mind when making assumptions for further analyses.
Trim your reads to include only high quality positions
Based on the quality analysis above, many people want to trim the reads to remove positions with low base qualities (i.e. positions in which the sequencer is less sure about which base to call).
| Trim the reads of DRR000542 such that all position have median quality score of above 20. You can use 'FASTQ Trimmer by column' for this. |
|---|
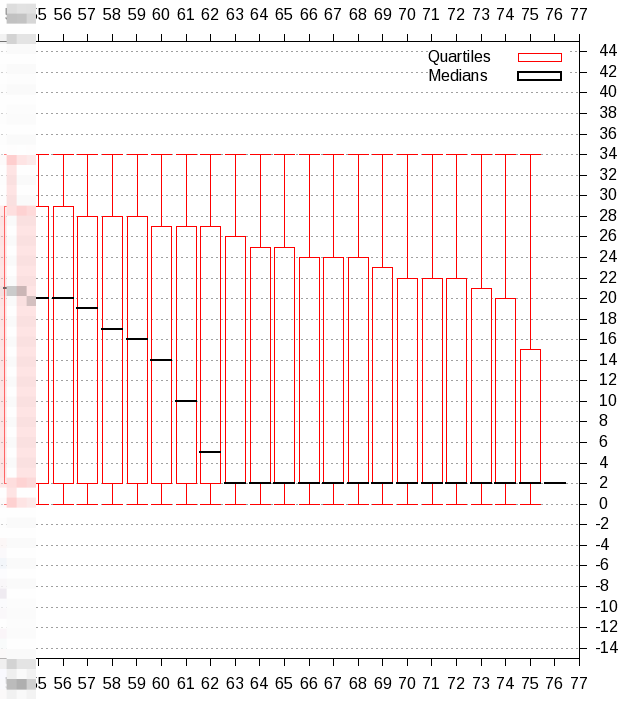
| First make a more detailed quality score check with 'Compute quality statistics', followed by visualisation with 'Draw quality score boxplot' |
| From this plot we observe that we have to trim 25 resp. 20 bases from the 3' end of the reverse resp. forward reads. |
| Open the tool "FASTQ trimmer by column" and trim both datasets with the correct settings. |
These trimmed reads we will now use for mapping in our next tutorial.
Workflow
To standardize your quality control steps, you can do all the analysis steps of one dataset, and extract a workflow out of your history. Then you can apply this workflow on all your Fastq datasets at once.
Go to back to Galaxy beginner's tutorial#Galaxy 'DNA' workshop exercises
