Additional exercises on sequence similarity
Go to parent Basic bioinformatics concepts, databases and tools#Exercises_during_the_training
Version 5 Nov 2011 by JJ
Version 4 Jun 2011 by JJ
Version 3 Feb 2011 by JJ
Version 2 by Joachim Jacob
Version 1: Guy Bottu
Do these exercises only when you have time left after doing the exercises on the previous page .
Contents
- 1 Additional exercises on sequence similarity search
- 1.1 FastA at the EMBL-EBI
- 1.2 The NCBI VecScreen tool
- 1.3 Mass spec peptide
- 1.4 Dotter, a small useful tool to quickly visually compare two sequences
- 1.5 Dotter with protein sequences
- 1.6 Dotplot to reveal palindromes
- 1.7 The sequences that will save your scientific life
- 1.8 Nice graphical comparison of two sequences, using SIM6 and LALNVIEW
- 1.9 Comparing two long DNA sequences
- 1.10 Viewing trees
- 1.11 Advanced multiple sequence alignment
Additional exercises on sequence similarity search
These exercises are additional to the basic exercises: first make sure you have made all basic exercises. Then you can make the exercises below in any order you want.
FastA at the EMBL-EBI
Introduction of FastA
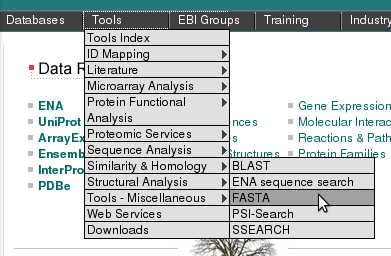
Pearson's FastA finds similar sequences in a database given a query sequence. FastA is older than the popular BLAST, it is slower, but sometimes finds things that BLAST does not find, especially for non-coding DNA (e.g. promotor sequences). We will use the FastA server of the EMBL-EBI, which has a richer collection of databanks. Go to http://www.ebi.ac.uk, then select the menu item "Tools"/"Similarity & Homology"/"FASTA".We will search with a fragment of the bacteriophage lambda genome containing the third right operator (OR3) and the right promoter (PR) to find similar sequences in the bacteriophage section of EMBL databank. (Note:running against the complete EMBL databank as compared to the bacteriophage section would take to much time for this exercise session - remember that fasta is rather slow).
| Get the sequence with accession number M25165 in fasta, download it and save as M25165.fasta. Try yourself first, click 'Show' for tips. |
|---|
| Since we have a universal accession number we can use all major portals. |
| You can use http://mrs.cmbi.ru.nl, search and download the sequence. |
| Or you can use http://www.ncbi.nlm.nih.gov/sites/entrez, search and download. |
| Or you can use http://www.ebi.ac.uk/, search and download. |
| |
By default the FASTA search page is set up for protein similarity search. Since we want to search nucleotide, we have to switch to the Nucleotide Databases' under 'Other types' in a box at the right side of the screen.
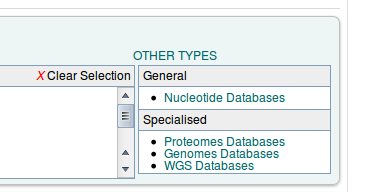
After that, we can select the database and our query sequence.
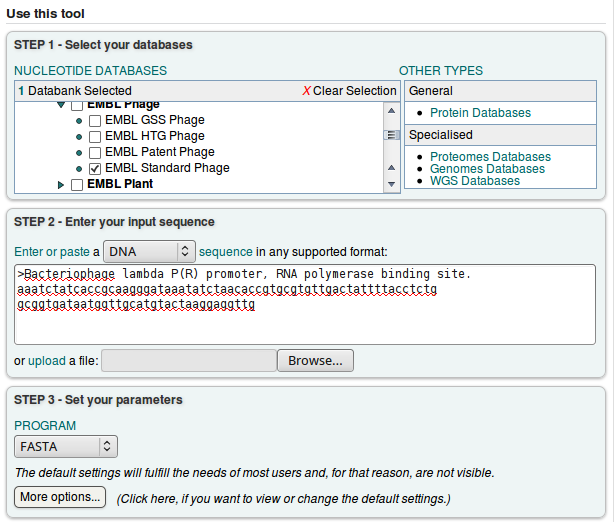
We will choose the default FASTA program, and click ![]()
Exploration of the output:

- fasta program is run on the server of EBI with the parameters you provided. The "raw" output of the fasta program (text) has been postprocessed by the website into a nice layout. So now you are presented a list of sequences similar to your query sequence.
- First you might check the parameters by going to Submission details. Check if the database should be 'em_rel_std_phg'. Then go back to the summary page.
- In the actual fasta output you find the list of "hits", ordered by E-value. You can group them on the different columns by clicking on the header.

The first value you should check, is the E(xpect)-value, which is number of similar hits happen purely by chance (similar = similar length in a similar database). So 5.5E-13 means that once in 5.5*10^13 searches with a similar but random query and a similar but random database, such a hit will be found (by chance). So 5.5E-13 is a good E-value. If the databank sequence is longer, the E() values are better (lower) and the scores will be higher. This is because the chance to obtain a similar score for an unrelated sequence of same length is reduced.
The column called 'Length', 'identities' and 'positives' should explain themselves: the length of the hit found, the % of identical residues, and similar residues. In case we are dealing with nucleotides (as now), similar has been put equal to identical.
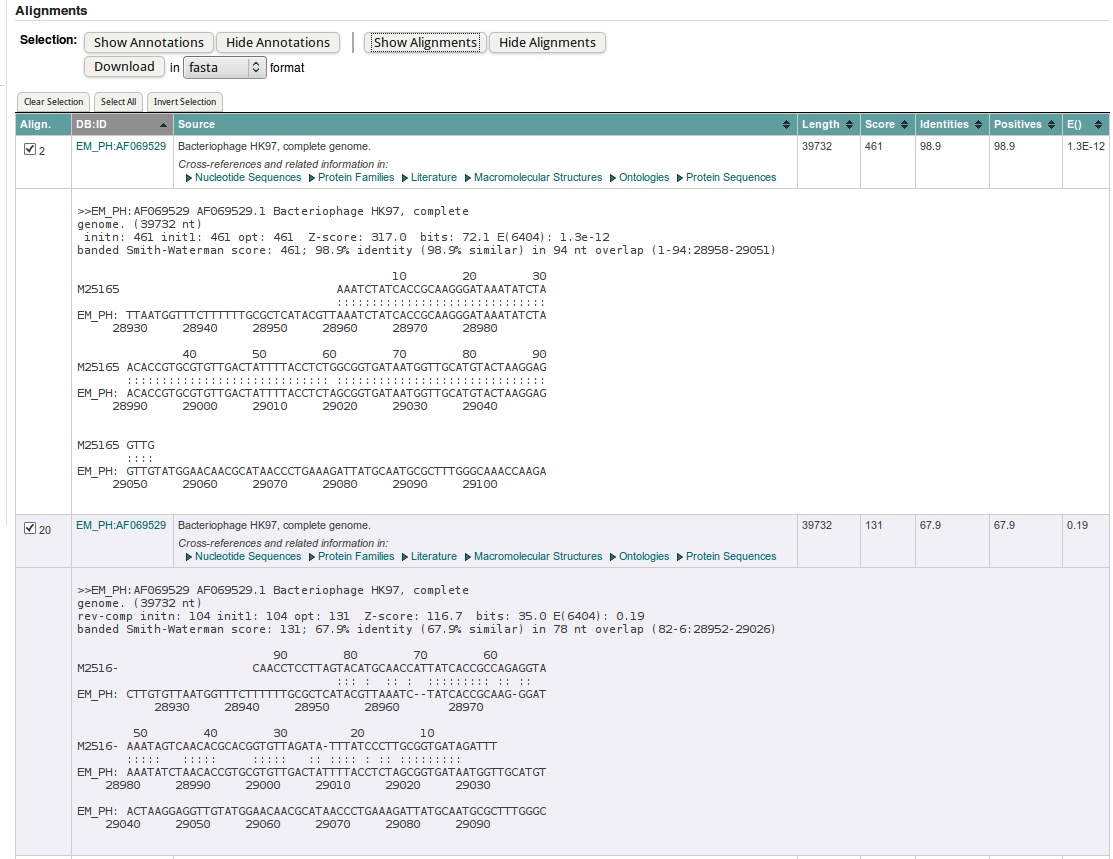
| Order the hits by DB:ID column. Check the ID's of the first two hits. What is their E-value? Which is most similar? |
|---|
| Click on the header of the DB:ID column to order by ID: 'EM_PH:AF069529' should appear on top. |
| The first two hits are actually recorded from the same sequence, AF069529 (out of the EM_PH database). The first hit has 1.3E-12 the second 0.17. |
| What has happened here is that FastA has found two similar regions to our query. He has reported each hit separately. |
| So the first hit (1.3E-12) is the best hit. This is also apparent from the number of positives and identities. |
- FASTA searches not only the query sequence but also its complement against the databank; this makes sense because we do not know in advance the orientation of eventual homologues in the databank. You can see this from the coordinates in the alignment for the first two shortest hits.
- To have nice graphical view of the results, click on Visual Output
Summary
- You might use Fasta when searching non-coding nucleotide sequences (UTR, promotor regions,...)
- Unfortunately, Fasta webinterface at EBI accepts only one sequence per submission
The NCBI VecScreen tool
Databanks sometimes contain errors. In this exercise we will prove that a human sequence from EMBL still contains some piece of cloning vector. We will use the VecScreen tool of the NCBI, which performs a BLAST search against the UniVec databank, which contains vector sequences from Genbank and some never published sequences from commercial sources, selected in such a way as to provide a nonredundant set.
You can start by taking a look at the file M34511.embl.
Then, go back to the NCBI BLAST home page and follow the link "vector
contamination" in the "Specialized BLAST" list.
Copy-and-paste the content of the file M34511.fasta and "Run VecScreen". In the result page you will have to click "View report". The interpretation is rather obvious : the sequence is contaminated, although the reported exon falls outside the vector remnant. Note by the way that if you used a similar tool at the EBI, which runs a BLAST against EmVec, you would not have seen the contamination, because the vector sequence is not in EMBL/GenBank/DDBJ.
Mass spec peptide
| Solve the following. A peptide tag has been obtained from a mass spec experiment: GAGYGRALGGGSFGGLGMGFGGSPGGGSLGILSGNDGG. Can you see what happened? |
|---|
| BLASTing reveals similarity to human keratin. Most likely we are dealing with contamination. |
Dotter, a small useful tool to quickly visually compare two sequences
It can be rather difficult to find a good dotplotting program: we try to gather all of them on this wiki, under the Dotplot page.
One of the best dotplot programs, is Dotter program of Sonnhammer and Durbin (see Basic bioinformatics concepts, databases and tools for download and installation). More info and installation of Dotter here. Dotter is already installed on the BITS laptops. The Dotter program needs to be launched from the command line, also called the terminal or DOS box (windows). But let this not scare you off! A lot of tools in bioinfo work only via the command line (in windows or linux), so let's try to do some things here also. Luckily for you, we will use only the command line to start the Dotter program: the program itself is graphical.
To use Dotter, you must first open an MS-DOS box in Windows: go to start, choose 'Run...' and type:
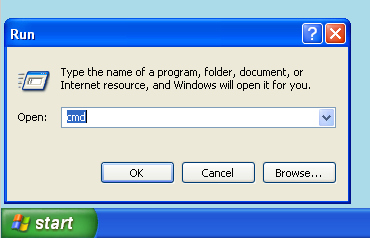
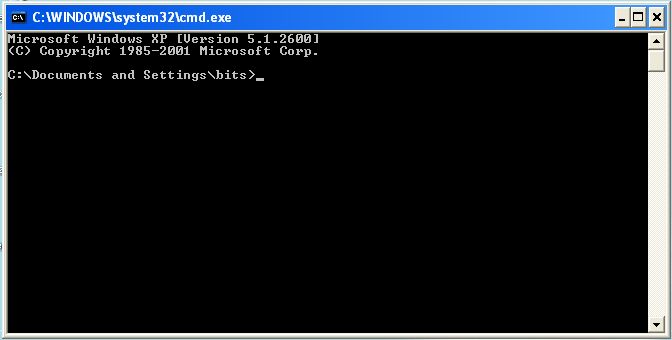
Next, we have to navigate to the directory where the data that you have downloaded is (in our case the fasta files, for example under C:\data-bioinfo). The first thing you type on a command line is always a command, followed by options and an argument. The command we need is change directory, cd, followed by the path to the folder. So, type on the command line (note that DOS commands are case-insensitive):
cd C:\data-bioinfo
dir
'dir' shows you the contents of the directory. You should see AF049064.embl, etc. We will use the fasta files x62302.fasta m24173.fasta.
To let the command line know where he can find the program dotter that we have installed (which is not a default windows program), we have to tell it to the MS-DOS interpreter (that interpretes what we type on the command line). For this, we execute setpath.bat (small program that does this for you) by typing:
setpath
Setpath.bat is just a little textfile that tells where to find the program dotter. Now we can execute dotter. Enter the following:
dotter x62302.fasta m24173.fasta
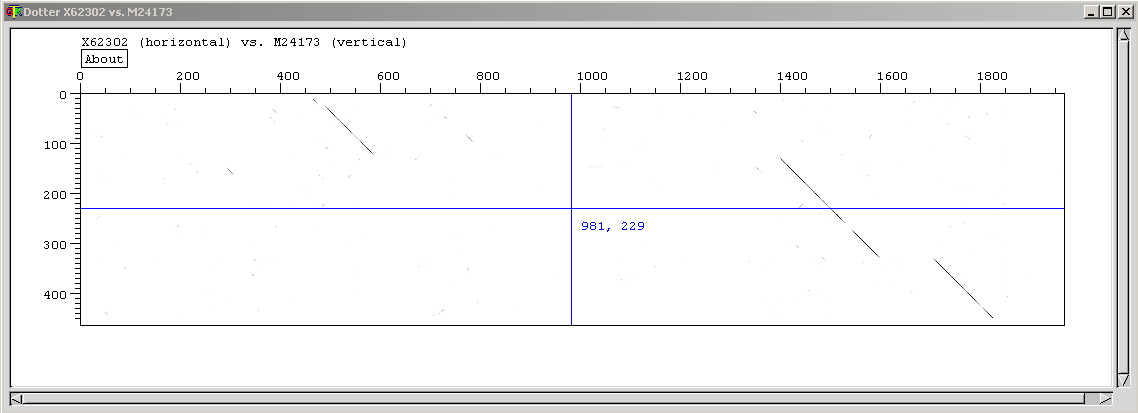
The first word is the program (dotter). The following two words are called arguments and depend on the program what it should be. For Dotter, the arguments need to be the filename of the two sequences you want to compare. Dotter computes and prints a dotplot with the sequences X62302 and M24173 on respectively the horizontal and the vertical axis. One of the two contains a cDNA sequence (of human), the other one contains the complete gene sequence (of mouse).
You will get a window with the dotplot, a window with the sequences and a small box with a grey ramp. The longer sequence (gene) is on the X-axis, the shorter (cDNA) on the Y-axis. In the dotplot window there are crossed blue lines, you can drag the crosspoint with the mouse, causing the text in the sequence window to follow, according to the position of the cross. You can move one base at the time by using the arrow keys. You can estimate the positions of the three exons (and by consequence of the two introns) by projecting the diagonals of similarity on the horizontal axis. The blue lines are a great help for doing this with precision.
Note also that with the "About" button you can get information about how the dotplot was computed.
| Why are the diagonals in the dotplot not a 100% black line and often have small gaps? |
|---|
| This is because we have compared the sequence of mouse with human. The positions which correspond have a black dot (the exons), but due to evolutionary distance, the sequences of the exons do not correspond 100%, hence on several positions within the exons, no black dot is present. |
Dotter with protein sequences
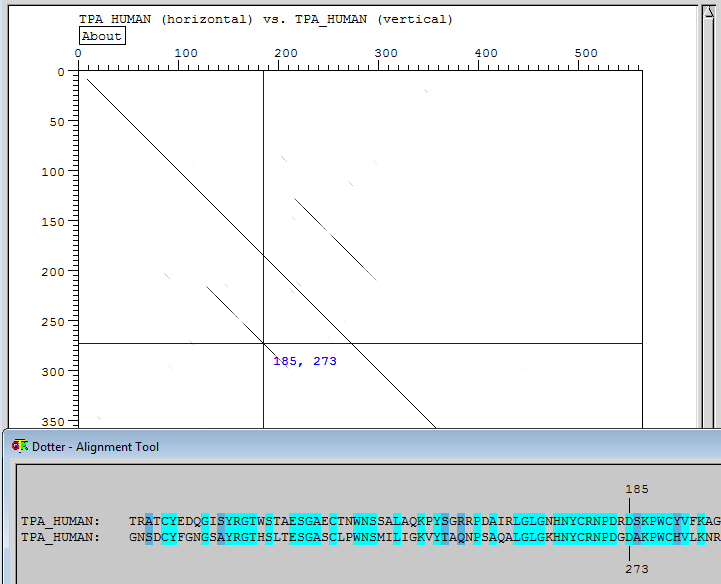
The human tissue plasminogen activator precursor (in UniProt/SwissProt with ID TPA_HUMAN and AC P00750) contains two "kringle" domains. "kringles" are
protein domains (protein sequence parts that are shared between different proteins - see next module) that have a typical structure and are involved in the interaction of certain blood proteins with each other and with cell membranes. We will see protein domains in the next part: sequence analysis. But for now: to know more about this protein domain, you may want to check this site.
You can find the file TPA_HUMAN.fasta in the C:\data-bioinfo folder, to solve the next exercise.
Dotplot to reveal palindromes
Dotplots can also easily reveal palindromes by making a dotplot of a sequence against its complement. A palindrome is a symmetric piece of sequences in which the first part is the same as the reverse complement of the second part. For example Parvovirus genomic sequences (acc number M32787) contains a palindrome.
| Try to identify the palindromes in this sequence using dotter. |
|---|
Dotter automatically also computes a dotplot using the reverse complement of the first sequence (with other programs you might have to explicitly ask for it). You can see that at the very 3'-end there is a palindrome, readily visible because the dotplot shows two small segments making a right angle with the main diagonal.
The sequences that will save your scientific life
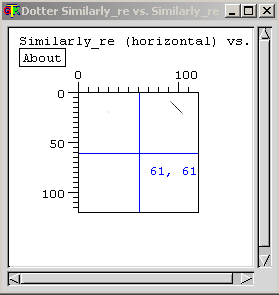
An experiment of yours concludes that two proteins are similarly regulated. So you get the sequences of those proteins. Funny though, at first sight, you cannot find a similarity between the proteins. Is this a mistake?
>Similarly_regulated_protein1
KGMYYKNEHFTDKCSGNPFHGQSCAFHNIWIPRLFGPQEKVEPASCTHCGDGLYSAPQAL
DLEEQTAWTSGPWTCRKYVPVCNKEWLNFKDIEQCGCGGHKLPYYVMSSMMWTPGTTHVK


>Similarly_regulated_protein2
GEHFHPTNDDMCGCGGHKLWFQEQHGIFALKSPEDYMDFGQMQSTNTIDWIALNVCWEYI
ECFTLPTCTAWWKKGSLCLFDHFCIKCWMDHIWLNHIMMDNCRNNYRSHSMGINLMVFLW
Nice graphical comparison of two sequences, using SIM6 and LALNVIEW
The SIM6 program of Huang and Miller calculates the best local alignment, and also a series of non-overlapping suboptimal alignments. Laurent Duret made a modified version of SIM that writes output in .lav format, suitable to be visualized with the graphical viewer LALNVIEW.
Go to the web site http://www.expasy.ch/tools/sim-prot.html. Although SIM can handle nucleic acids as well as proteins, the Web page at the SIB is configured only for proteins. Note: it is possible to download and compile the source code of the modified SIM and use it locally, also for nucleic acids.
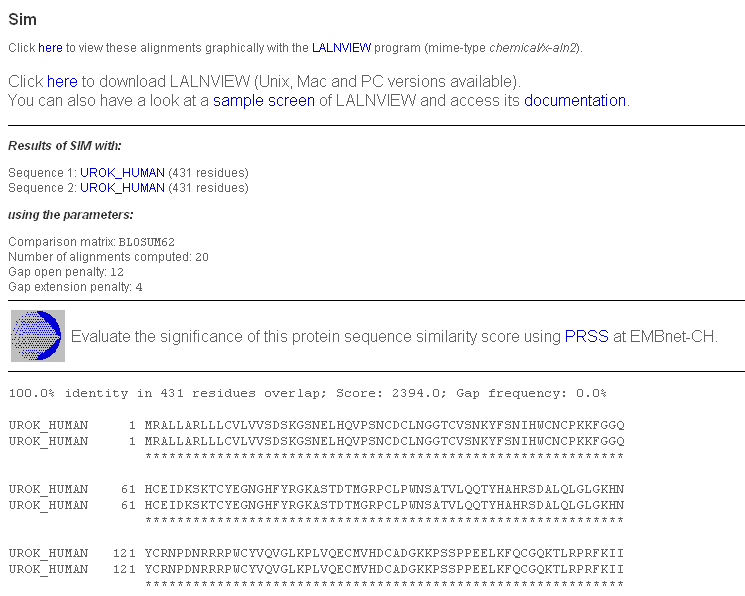
We have already mentioned the "kringle" domains. While the tissue plasminogen activator contains two "kringles", plasminogen contains five and the urokinase-type plasminogen activator contains only 1. Type plmn_human in the "AC or ID" box for "SEQUENCE 1" and urok_human in the "AC or ID" box for "SEQUENCE 2", then click "Submit". You will get a page with the classic SIM output.
Click on the "here" from "Click here to view these alignments..." and save the file 'view-laln-file.pl' (or whatever you wish to rename it). Start LALNVIEW on your PC: you can find it under "All programs". Select "File"-->"Open" the file.
You see 2 alignments with a score of more than 120 (BLOSUM62) represented by coloured bars. You can click on any part of the coloured bars to adjust the alignment of the bars. Only similar portions with a score higher than 120 are displayed. You can lower this score by replacing 120.0 in the "Similarity Score Threshold" box by 50.0 and press <enter>.

You will then see 5 alignments. To get more information on a portion of the sequence, note the additional bars above and below the upper and down sequence bar. Clicking on those will reveal the name of the domain and motifs. Note however that this information has simply been extracted from the annotation that accompanies the sequences in the SwissProt databank, it has not been computed.
![]()
We can see that the first 4 correspond to an alignment of a "kringle" of plasminogen with the unique "kringle" of urokinase, the 5th alignment encompasses the last "kringle" of plasminogen as well as all the motifs that follow. If you click on a coloured bar, the alignment will appear in a second window. If you set the threshold to 0 you will see even more alignments, up to 20 ; the reason is that SIM cannot evaluate significance, it continues to compute non-overlapping alignments with ever decreasing scores until no alignment with score higher than 0 can be found or until a limit (here set to 20) is reached.
There exists also a SIM2 program that computes local and suboptimal alignments using the fastA algorithm (and is in fact identical to the lfasta program from the fastA suite); SIM3 and the improved version SIM4 [1] are designed to align a gene with a mRNA, with a provision for finding splice sites.
Comparing two long DNA sequences
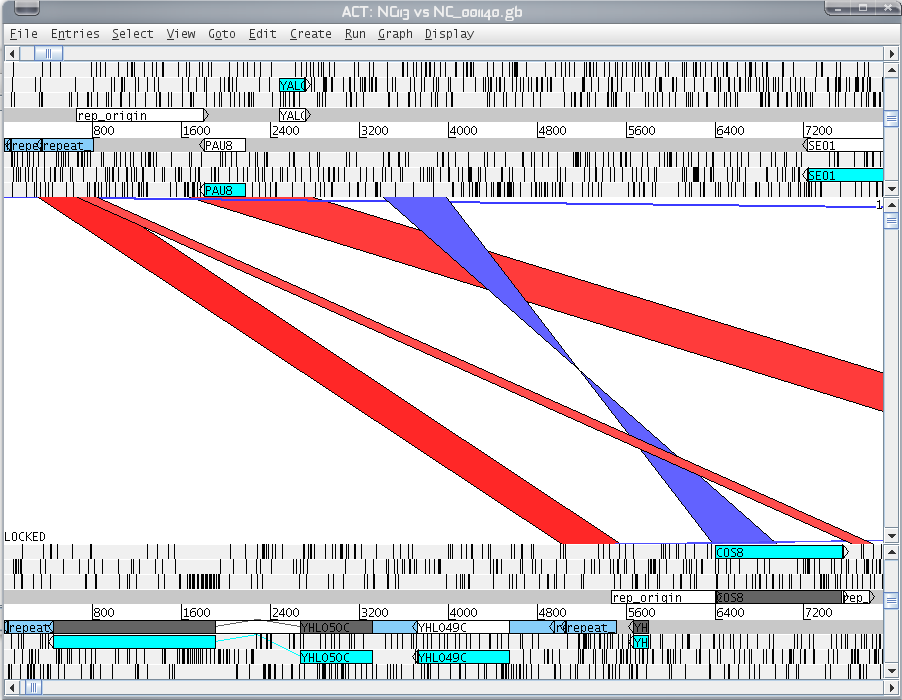
Look back at the question from above concerning blast2seq [2]. We identified one reverse complemented region in ChrI and ChrVIII of S. cerevisiae using Bl2seq. You can use the output of Bl2seq to analyse this a little further. Follow this question:
| Which genes lie in this reverse complement insertion? You can use for this the ACT (Artemis comparison tool). |
|---|
| The steps are explained on in this how to on our wiki. |
Viewing trees
Trees, such as to guide multiple sequence alignments, are stored in different formats, for example .dnd. This text file stores a tree in a not human readable format. A program that can display those trees is Treeview. In fact, TreeView can be used to view all kinds of trees. Treeview is installed on your computer.
Start TreeView and open the file ADHs.dnd using the "File"/"Open" menu. Note in the toolbar at the top 4 icons in a row to display the tree in various way. Do note that this tree is the "guide tree" used by CLUSTAL to guide the progressive alignment. It has been made from distances computed from pairwise alignments, not from distances taken from the multiple sequence alignment, and without taking into account all the subtleties involved in computing a real phylogenetic tree, so you should not use it as such. CLUSTAL does have a rudimentary capacity for making phylogenetic trees. However, there exists a lot of methods and programs to compute phylogenetic trees. This subject is beyond the scope of this course.
Advanced multiple sequence alignment
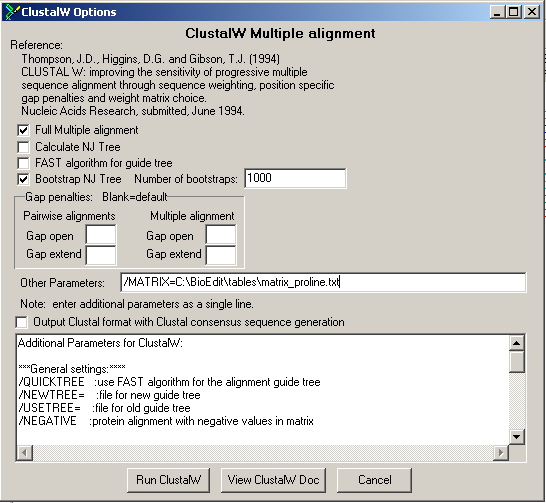
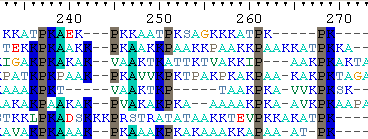
We take a look at the alignment of the 8 plant histones again. Note that at the C-terminal end a lot of prolines appear (embedded in basic residues as R and K). We will demonstrate the following principle in Bioedit.
Go to parent Basic bioinformatics concepts, databases and tools#Exercises_during_the_training
