Venn and other plots
From BITS wiki
Venn diagram can be used to summarize categorical data and outline intersection between different datasets.
Building a Venn diagram for two lists is an easy task, but what about making one from 3, 4 or 5 list?
Please read the recent points of view by alexander Lex & nils Gehlenborg in Nature Methods (08/2014) about representing sets and intersections[1]
Contents
BITS scripts to create Venn pots from precomputed counts
Please refer to the wiki page Create Venn plots from counts and download the code from the BITS GitHub repo[2].

software to build venn diagrams
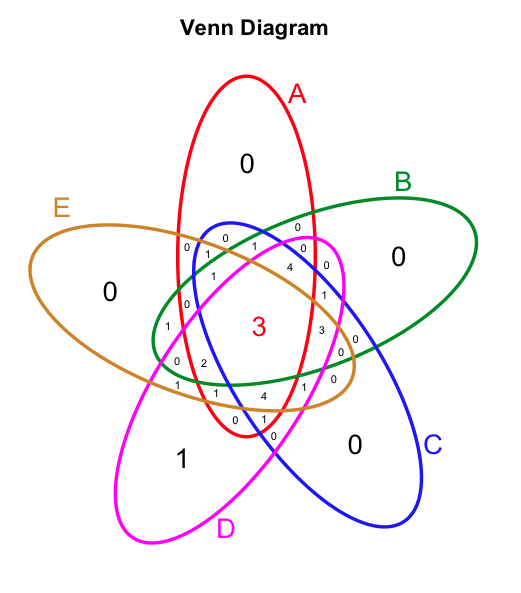
- R can generate venn diagrams from unlimited groups in minutes: here pieces of R code and examples (below a Venn graph example from 5 lists from the linked page)

Author: Thomas Girke, UC Riverside
- VennMaster - unlimited number of groups, JAVA
- Venn diagram webtool of PSB department of VIB - up to 3 groups, web
- EulerAPE. Ellipses are far more accurate than circles, and still look good. The software has an SVG output option, JAVA
- Euler 3 Applet. Allows zero size regions and always gives accurate region areas. Has an SVG option, JAVA
- Venny - up to 4 groups
- Use Google API charts - up to 3 groups, API
- DrawVenn, up to 3 groups, JAVA
- DrawEuler - any number of groups, JAVA
- Pangloss - up to 4 groups, web
- VENNTURE - up to 6 groups, windows only.
- BioVENN - up to three groups with proportional size, web
- UpSet - Visualization of Intersecting Sets (web-server)
software to build BoxPlot diagrams
If Venn diagrams are nice to display recall data, Box plots are ideal to show data distribution in many more details than a simple average value. You can generate Bow plots in few clicks using the following web application.
- BoxPlotR a web-tool for generation of box plots
References:
- ↑ http://www.nature.com/nmeth/journal/v11/n8/full/nmeth.3033.html doi:10.1038/nmeth.3033
- ↑ https://github.com/BITS-VIB/venn-tools
[ Main_Page ]