Ex 3 - Importing a gene or a gene-list into IPA
Go to parent Ingenuity Pathway Analysis training
Importing data
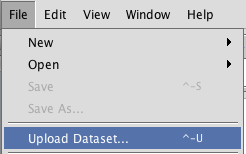
As already seen, IPA accepts many gene identifiers. So you can easily import data from other programs (such as Genevestigator), your own data set, published data etc. The entry for this is following menu item:
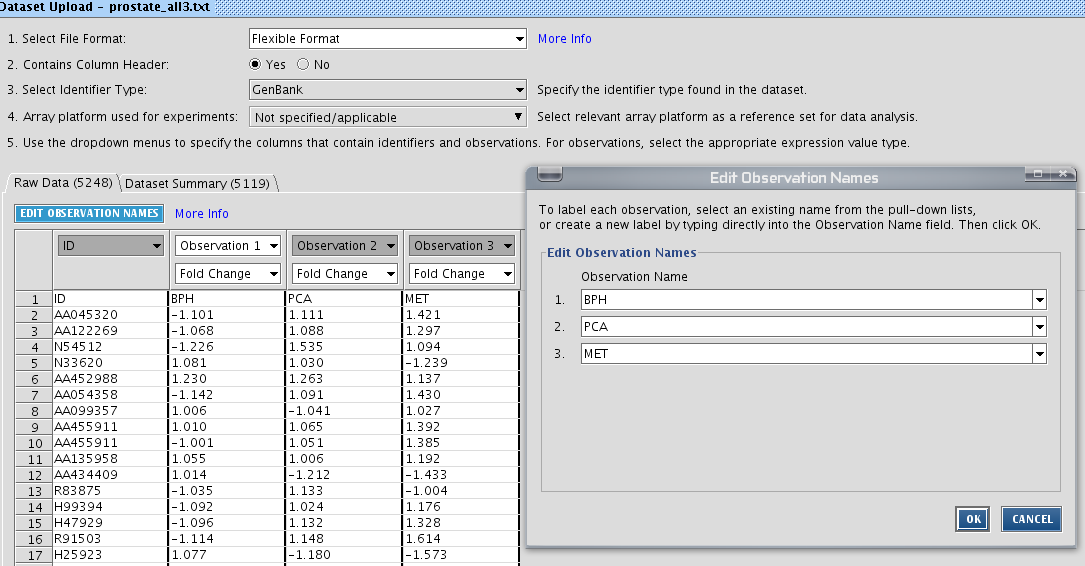
TASK Upload the prostate disease dataset ("prostate_all dataset"), which can be found on the training pages of IPA on http://www.bits.vib.be (training material) (
Examine this dataset in Wordpad. You see that it is a plain text file, with the first column a gene identifier, and the remaining columns. The values in the prostate dataset are part of a micro-array experiment, the log-ratio of the signal. Basically, IPA accepts any value in these text files. Just make sure you indicate the right data type. Let IPA know that there are column headers present. It is highly recommended you change the observation names by clicking ![]() .
.
Click Save. Your data should be imported now and it can be found in your project folder under Datasets.
Analyzing imported data
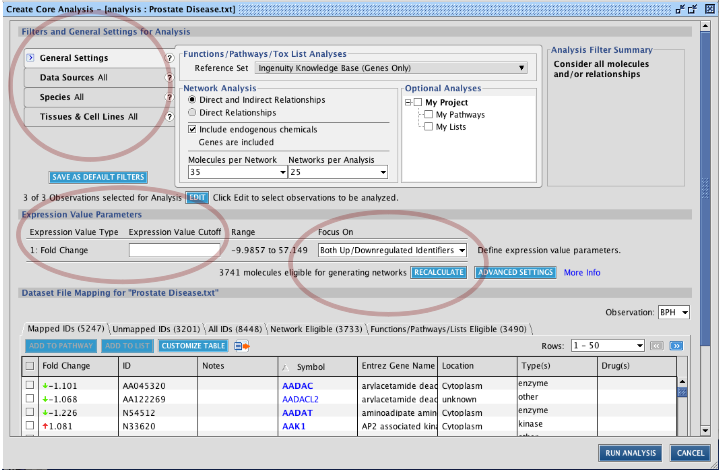
It would be interested to know what is happening in this data. IPA can identify which networks are overrepresented in the imported data. We will use for this the core analysis. Access it through File -> New -> Core Analysis... (or press ctrl+N). Note: here you can also directly upload a dataset and run a core analysis on it. Select the right dataset you have uploaded. Next the Core Analysis window appears. Here you can restrict the analysis to the topics you want: restrict to a species, restrict the information source used for analysis,... You can also set filters on the values in the dataset, so you can restrict the analysis on a part of the dataset. The last part of the screen with the tabs shows you preliminary information on the analysis. Note the small question marks: use them if you need more information!
TASK Prepare a core analysis with the uploaded ‘Prostate Disease’ data: a) using only Ingenuity Expert Findings (curated information);
b) with at least 2-fold change in expression (not interested in barely regulated genes); c) only considering down-regulated gen (as a specific research question)
How many genes pass the filters? You can check it by pressing ![]() .
.
156 genes pass the filters (as of June 2010).
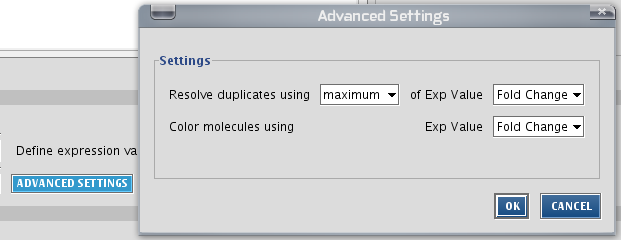
Note: if your uploaded data contains several identical gene ids (e.g. probe sets), let IPA know what to do with it by clicking the advanced button. The values can be averaged, or the minimum can be taken etc.
Press the ![]() , save the analysis in the Tutorial project folder and have a break...
, save the analysis in the Tutorial project folder and have a break...
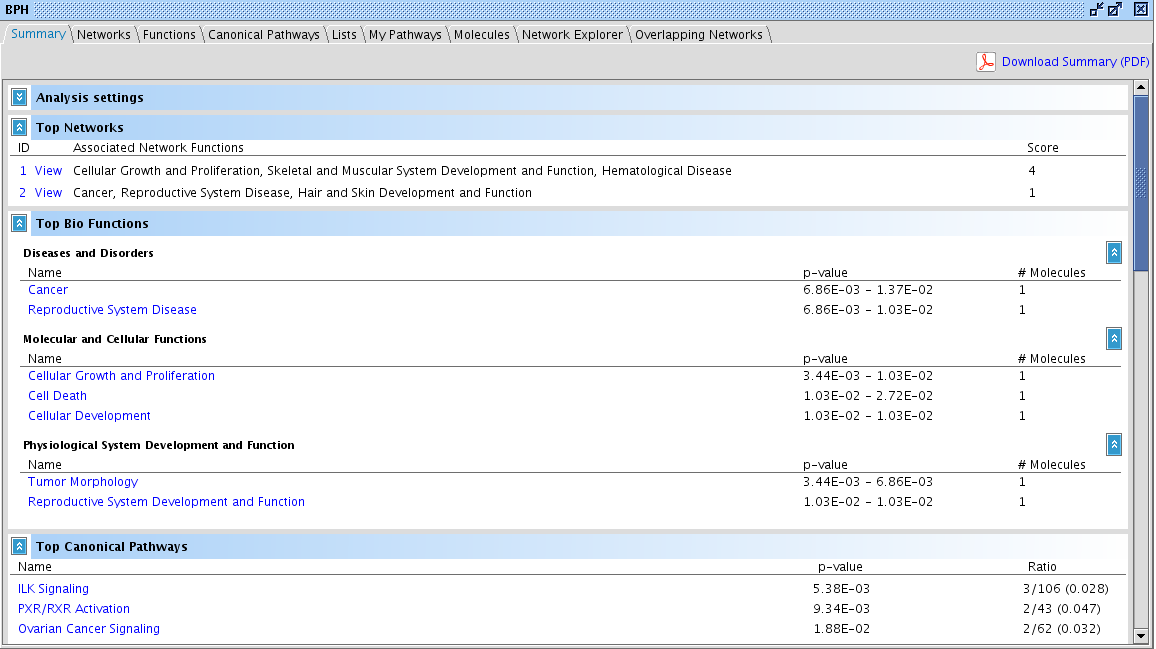
After a while, the analyses are ready. Double-click on the "PBH" analysis in your Analysis subfolder in the project manager (if the window has disappeared, call it back by clicking Window -> Project Manager). The analysis screen opens containing all the results.
Click on the Molecules tab and search which gene is most highly upregulated (click on the "Exp Value" column header). It is MMP7. You see that for each analysis run from the dataset, the expression value of MMP7 is shown in a small bar chart.
File:Ca results2.png
