Ex 2 - Extracting useful information from IPA
Go to parent Ingenuity Pathway Analysis training
It is easy to create in a few clicks hairy network balls in IPA. Here we will show tools in IPA to cut uninteresting parts of a network away and to add specific entities and relationships.
Contents
Lists are the gateway to many functionalities in IPA
First this. From in almost any view of IPA, you can add entities to a list. From such lists, entities can be exported to other programs (e.g. excel), can be put in a pathway and can be used to run an analysis on.
TASK Create a list of Alzheimer disease markers
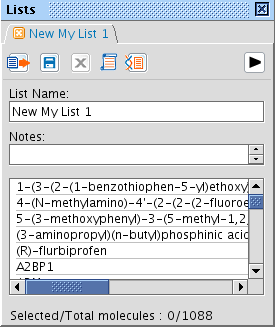
Search in Functions and Diseases for Alzheimer disease. Select ADD TO MY LIST > New My List (also right-clicking works).
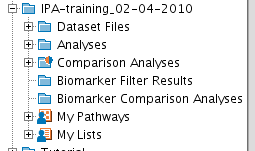
Now save the list in a new project folder, which looks like this.
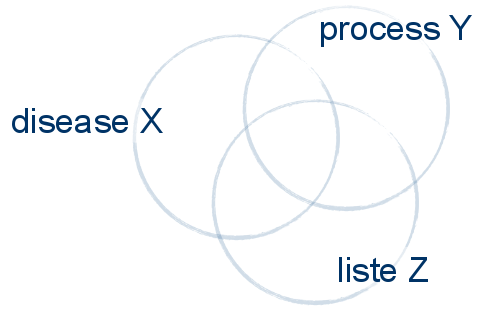
Use the COMPARE tool to find common and unique molecules to a process, a disease, a list,...
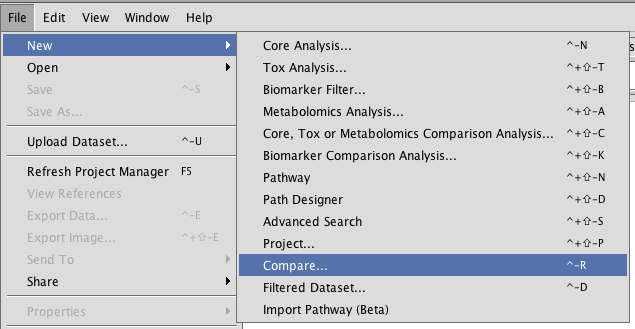
We want to add entities to a pathway which solely occur in certain conditions. A very interesting and powerful tool for this is Compare.... From File -> NEW menu item, several options are available. Clicking Compare... will bring up a window that analyzes two sets of entities for their unique, common or union entities. Everything in IPA can be compared, including lists.
TASK Search molecules common to the Parkinson signaling pathway and your list of Alzheimer disease markers
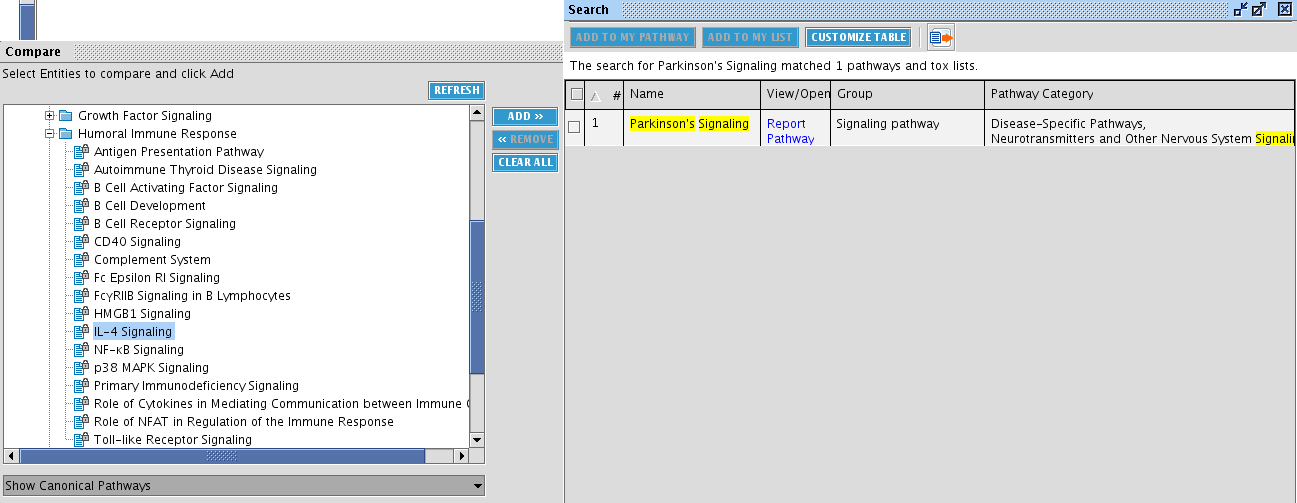
First select the entities associated with Parkinson's signaling. To assist with this, it is convenient to first search for Parkinson's signaling and observe in which category this pathway is (in the screenshot, the search box at the right). Then select the appropriate pathway in the Compare window at the left. Click the ADD>> button in the middle.
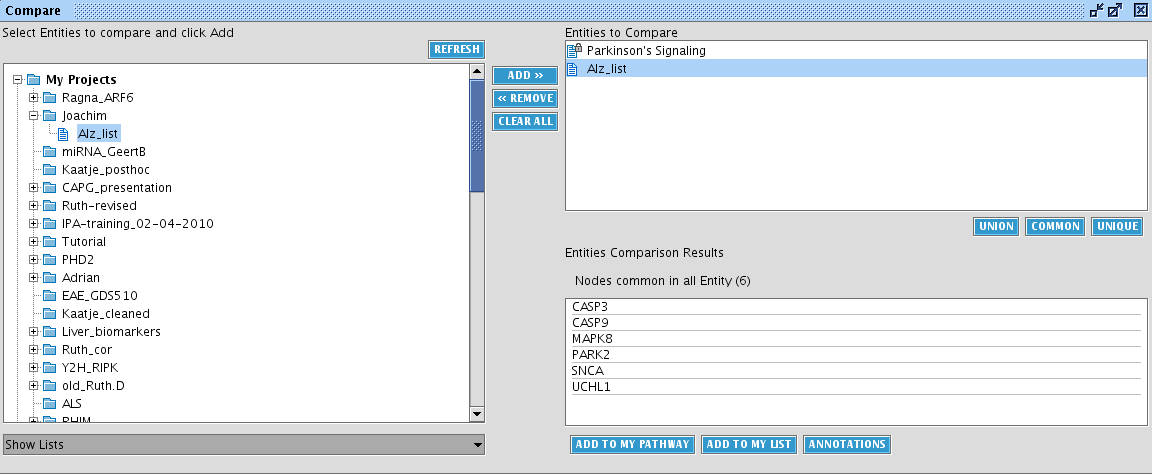
Next, add the list you have created above. Select at the bottom left Show lists and select the Alzheimer list. Click the ADD>> button in the middle. You can add as many sets you want. But for now, click COMMON to calculate the common entities between the lists.
We observer 6 common entities which can be subsequently exported to a pathway or to a list (buttons at the bottom). Click on annotations to bring up a view with detailed entity information.
Create and modify a network/pathway
For good understanding: a network means a whole of entities which have all kinds of relationships based on literature information and experimental evidence. A pathway is a network with a specific biological function (e.g. tyrosine signaling).
We have seen how to add entities to a Pathway window based on all connections to a certain entity, or based on comparing of different processes or diseases. Often, this view does not show all connections we are interested in. The Pathway window has several buttons that allow to grow or trim a network and display certain information on it.
The Build toolbox
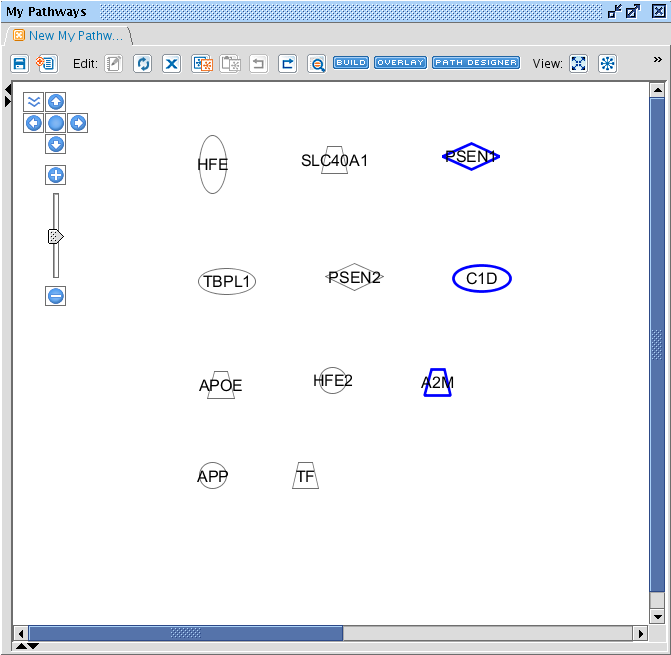
TASK Add following entities to a Pathway: A2M, APOE, APP, HFE, HFE2, LRP1, PSEN1, PSEN2, SLC40A1, TF, TFR2.
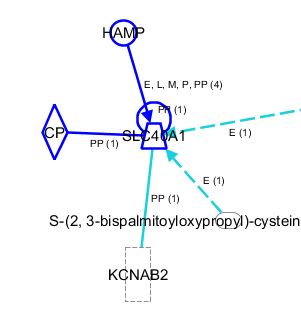
The result should look like this. When an entity is in blue, it is selected. You can select multiple entities by drawing a rectangle holding the left mouse button, or by pressing ctrl and clicking on the entities. When an entity is selected, it border is turned blue. Tip: you can select entities from another Pathway window and simply copy-paste them to another window.
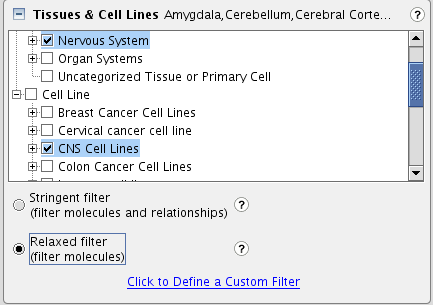
TASK Between these molecules, what connections exist in nervous system tissues as well as in CNS cell lines
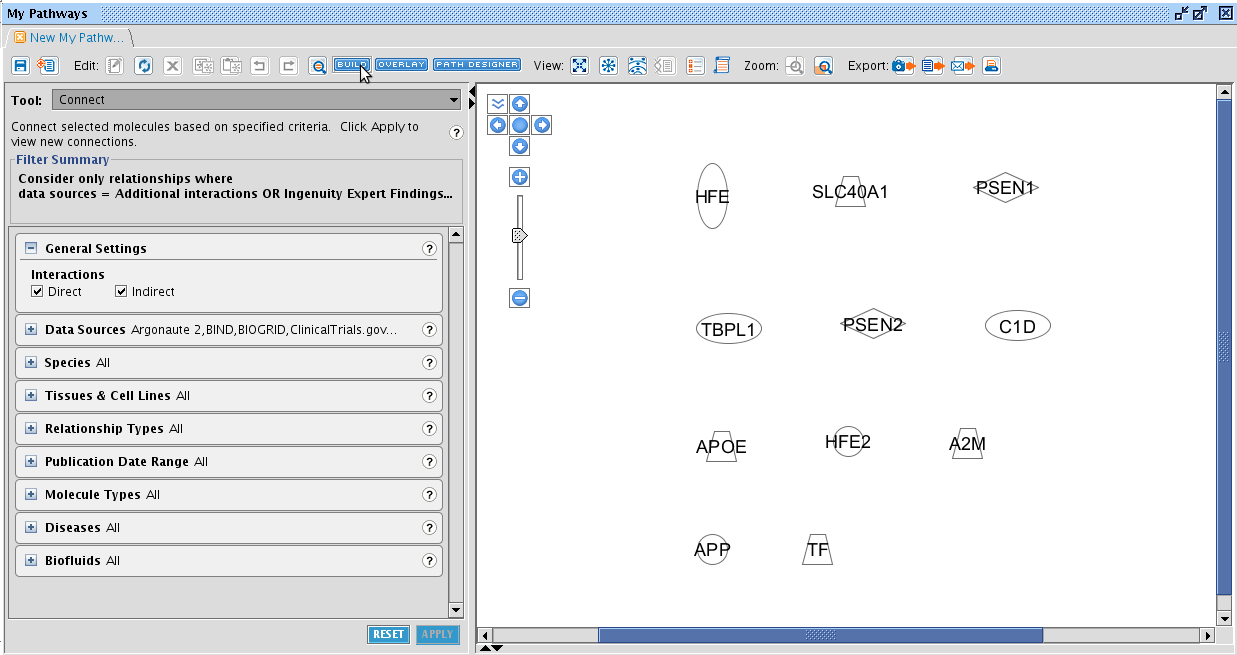
So we have entities added to a pathway. But no connections are made between them yet. In the My Pathways window, several tools are available to manage your network. For this task, click on the BUILD button at the top of the pathway tab. Examine the different tools that can be selected from the dropdown box at the left side. The Connect tool is the one we are searching for. This will add relationships to our network. Clicking on it will let an awful lot of options appear right beneath it. Tip: note the little question marks at the side. Click them for more information! It will bring you directly to the IPA learning centre.
The diverse filters allow to add relationships (connections) only with your specifications. So select relationships reported in the nervous system and CNS cell lines (under Tissues & Cell Lines). We select the relaxed filter, which will only apply the selections on the molecules, not on the relationships (other words: the molecules need to be expressed in the selected tissues, but the observed relationship may be reported in other tissues).
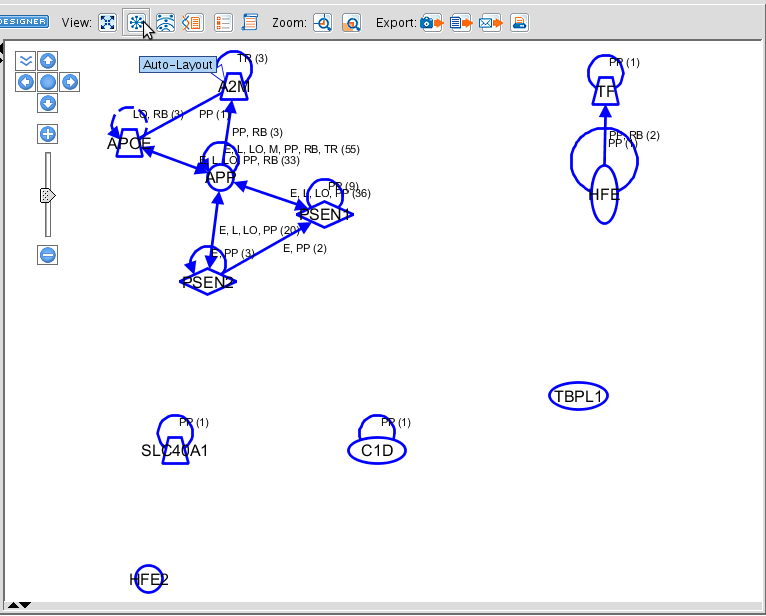
Now, before to add the connections, select all molecules. You can also select a subset to add the connections with these specifications. When you have selected all (dragging a rectangle, or pressing ctrl+a)n-, the APPLY button is ungrayed. Click on it to create the connections. Use the buttons right above the pathway window to organize the view automatically.
TASK Pick a gene that is not connected to add the first 5 molecules that are directly upstream.
Select from the main BUILD toolbox, the tool GROW. Specify the settings according to the question. The result should look like this.
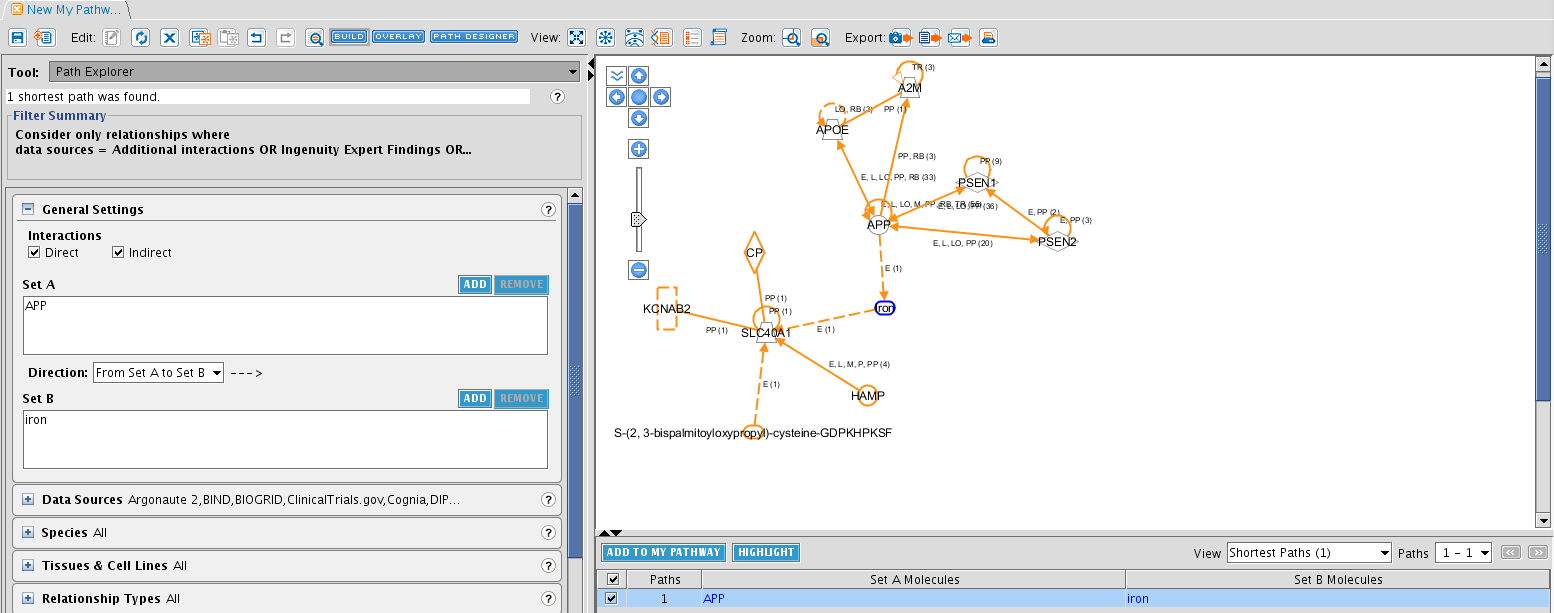
A very interesting Tool in the BUILD toolbox is Path Explorer: this tool will search the shortest molecular path between selected entities and adds the molecules and relationships to the network.
TASK Is there any connection between iron (as an upstream regulator of SLC40A1) and APP?
Select the Path Explorer tool. Select the APP molecule and click on ADD in Set A (left side in General settings). Do the same for iron in Set B. Click on APPLY and after a moment, the results show up in the bottom right of the screen. There is one relationship in literature!
The Overlay Toolbox
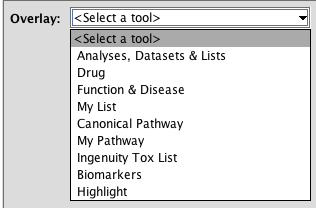
The Overlay toolbox contains tools to gather information of and add it to your current network. These tools analyze different aspects of your network.
Intermezzo
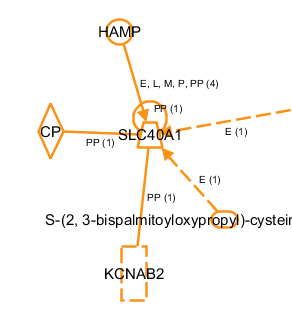
First a short note on selecting and highlighting. When molecules and relationships are highlighted, they are depicted in orange. By default, everything added to a network, is highlighted, hence displayed in orange.
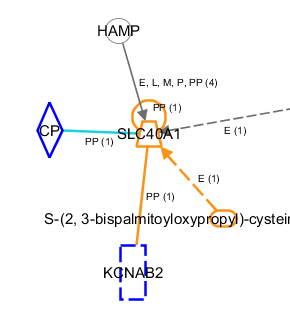
Just play around a little with highlighting and selecting. The purpose of highlighting is to be able with a few clicks to select the molecules you are interested in. Highlighting is a more permanent version of selecting.
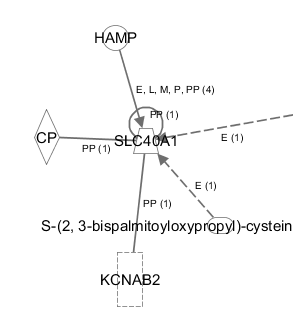
You can turn of the highlighting by right-clicking and selecting Reset Highlight. You will see that everything in your network will turn gray. Whether an entity of your network is highlighted or not, it can always be selected. When you simply click on it, it is selected an turns blue.
TASK Use the Overlay toolbox to display the functions of the molecules of the previous pathway
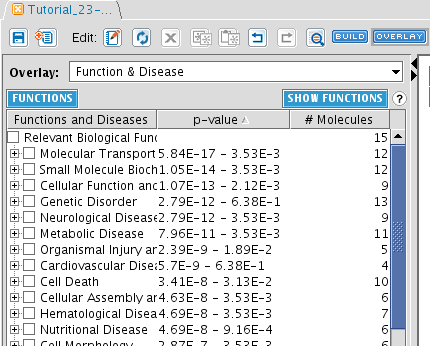
Click the OVERLAY button and select Function & Disease. When you do this, a list of most enriched functions in your network is displayed. The p-value show the chance that this enrichment is obtained by change. Note that it is a range, because each Relevant Biological Function contains several functions: it displays the lowest and the highest p-value in the function. For each entry, the number of molecules is also reported.
Click on SHOW FUNCTIONS to obtain a plain list of functions associated with the network.
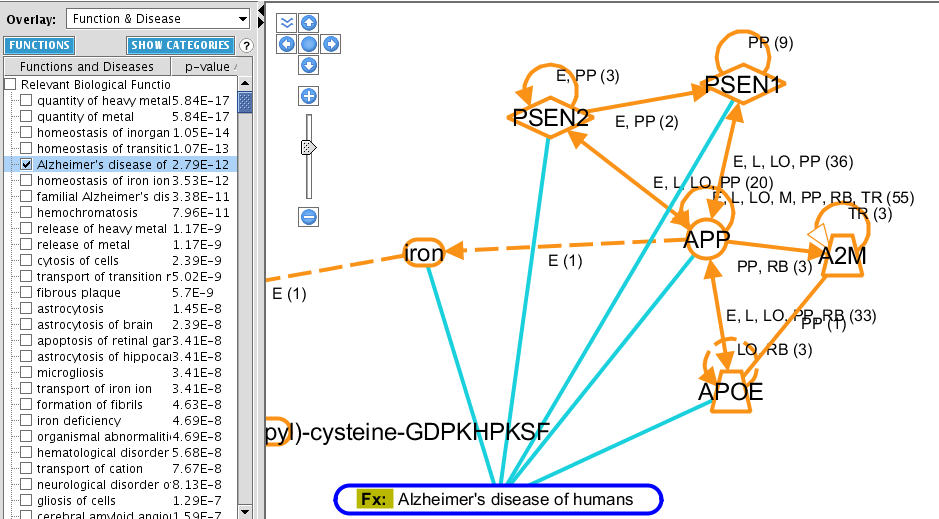
As for each entity in the graph, you can double-click the function (![]() ) and the connections departing from it to obtain more information. Right-clicking gives you also access to the references of each entity, by clicking the lowermost entry of the menu References. You will access a webpage from which you can export your references.
) and the connections departing from it to obtain more information. Right-clicking gives you also access to the references of each entity, by clicking the lowermost entry of the menu References. You will access a webpage from which you can export your references.
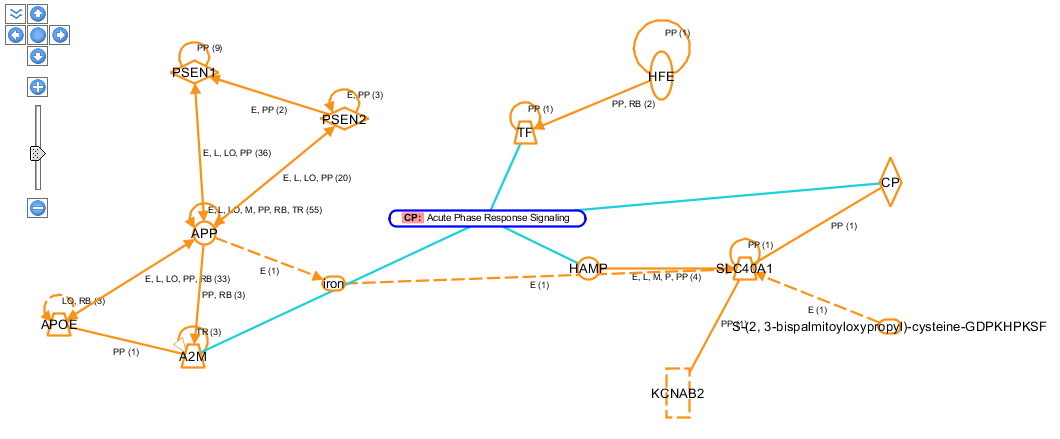
TASK What is the most prominent canonical pathway of this network?
Answer: see figure below.
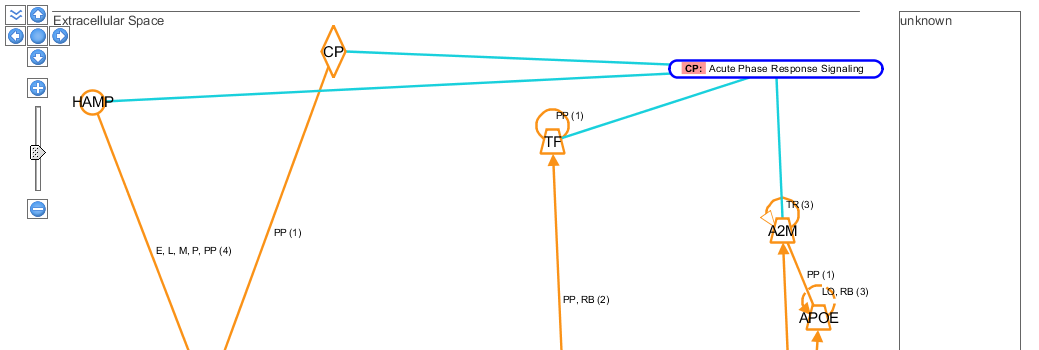
You can visualize the sub-cellular locations of the active forms of these molecules, by using the ![]() buttons.
buttons.

